Critique
Deck of the House of BCG. Twelve slides, one argument

BCG published a twelve-slide deck on data privacy to win the work that follows it. The argument is sound. Four charts fight it, one label undermines it, and the ask never arrives.
This is a good consulting deck with three fixable faults. The two-line headlines are the model to copy, and the sources on every slide buy it credibility. But a bubble chart and three slides of spiral charts hide the very point their headlines make, a draft label undercuts a published document, and the final slide stops where it should have asked for something.
The deck on the table
- House: Boston Consulting Group
- Deck: Data Privacy by the Numbers, March 2014
- Length: 12 slides
- Evidence: BCG's 2013 Global Consumer Sentiment Survey of 10,000 consumers in developed and developing countries
- Purpose: market research that ends in a question the house would like to be hired to answer
Every critique starts the same way. The deck is opened on the table and read as its audience read it, clean and unimproved. Someone else's slide is shown exactly as it was published, never redrawn and never prettified. Anything we rebuild is marked as ours.
BCG's deck reads as the house always reads: the answer stated early, every claim sourced, and a headline style that does more work than most. It also does what these decks are built to do, which is to leave the reader with a question, so that the answer can be sold. That is fair. The faults are in the charts and in the ending, and the six findings take them in the order a reader meets them.
Six findings
1. The title is clever. The question is better.
Keep, then sharpen. "Data Privacy by the Numbers" is snappy and a little clever, and it will be remembered. The stronger title is still the one that speaks directly to the question the deck exists to answer, because every audience walks in with that question and reads the title for the answer.
2. A draft label on a published deck
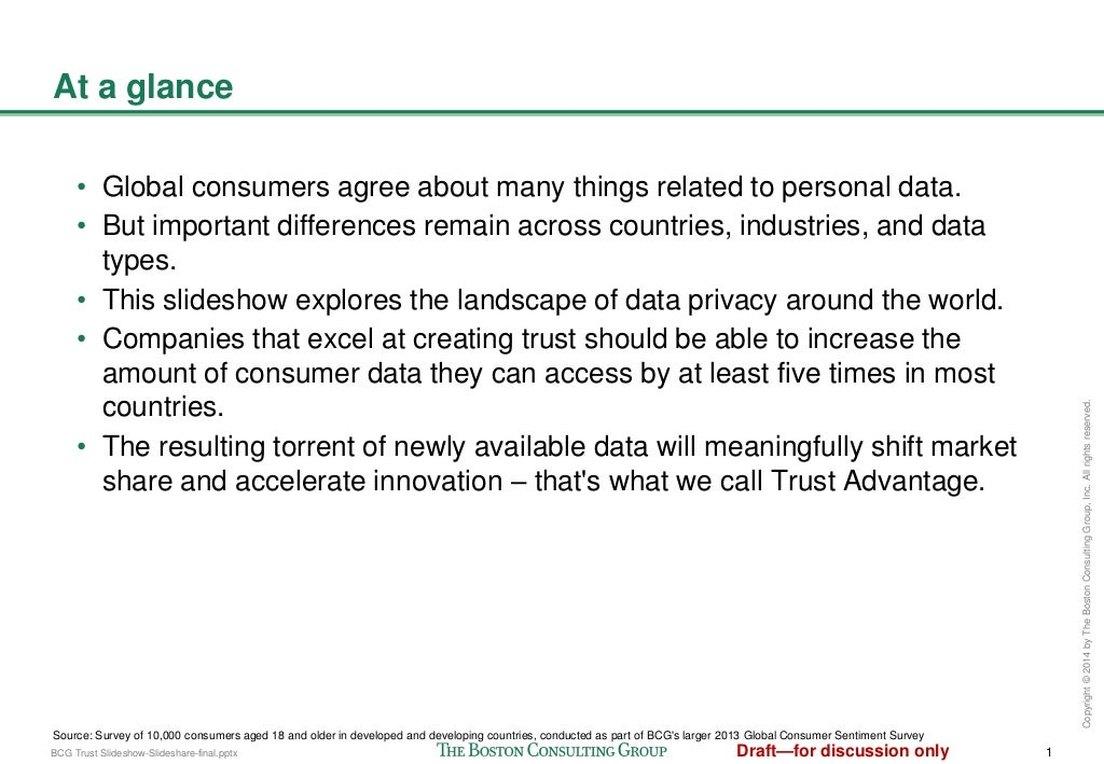
Cut. "Draft, for discussion only" sits in red at the foot of every slide after the cover. It has dubious legal weight, and none at all on a document the house has published itself. Toss it. While the knife is out: the bullets need air between them, which is a small thing that helps a lot.
3. The two-line headline is the model
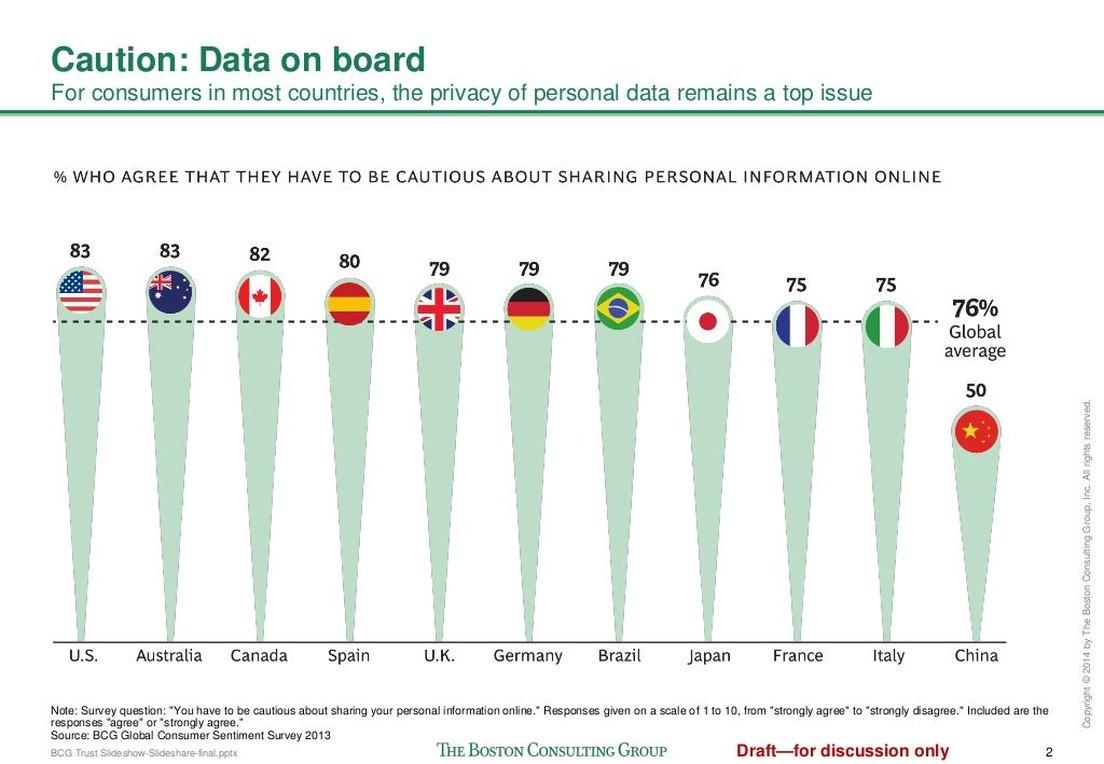
Keep. A pithy top line and a descriptive second line. The second line is the one that matters: it states the take-away, so a reader who reads nothing else on the slide still leaves with the point. Every exhibit in the deck has one. This is the house style worth stealing.
4. A beautiful chart, and the wrong one
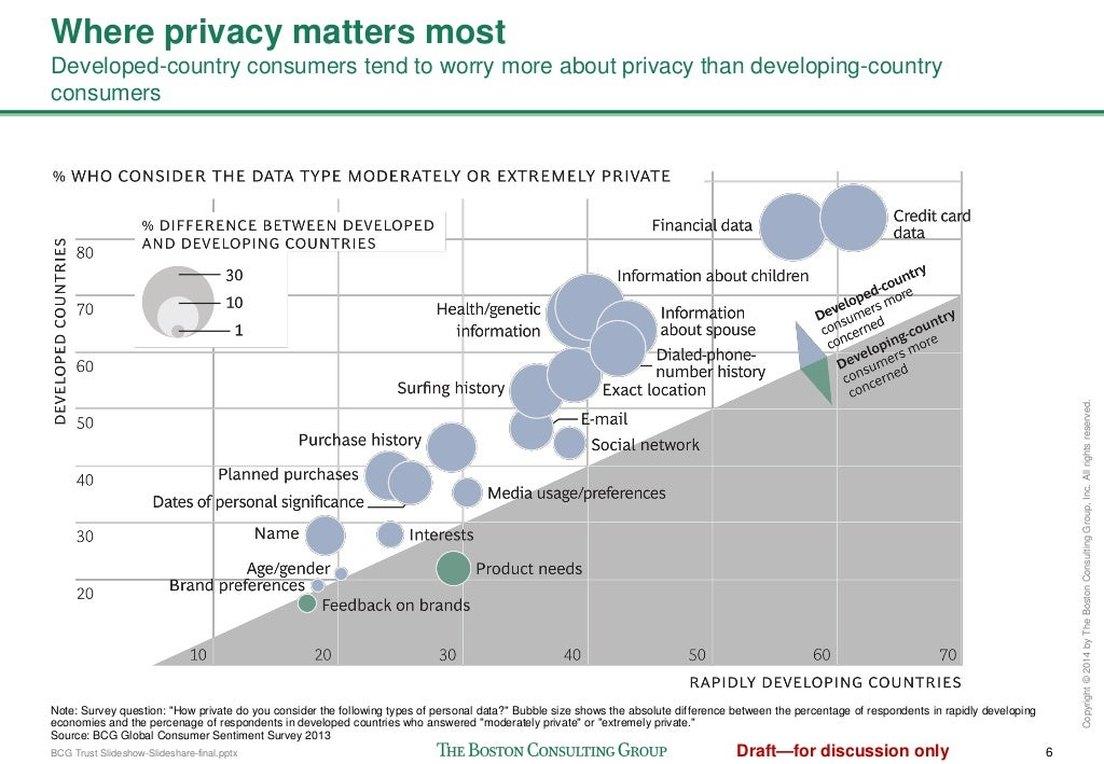
Redraw. It is a lovely bubble chart, and it asks a lot of the reader. The headline says consumers in developed countries worry more than consumers in developing ones. To see that in the chart you have to work out that a bubble above the diagonal means developed countries are more concerned, and that the size of the bubble is the size of the gap.
Meanwhile the eye does what it always does with a scatter. It draws a line from bottom left to top right and reads a correlation, which is not the point. Paired bars, one pair for each kind of data and sorted by the gap, would show the headline at a glance.
5. The spirals hide the point they make
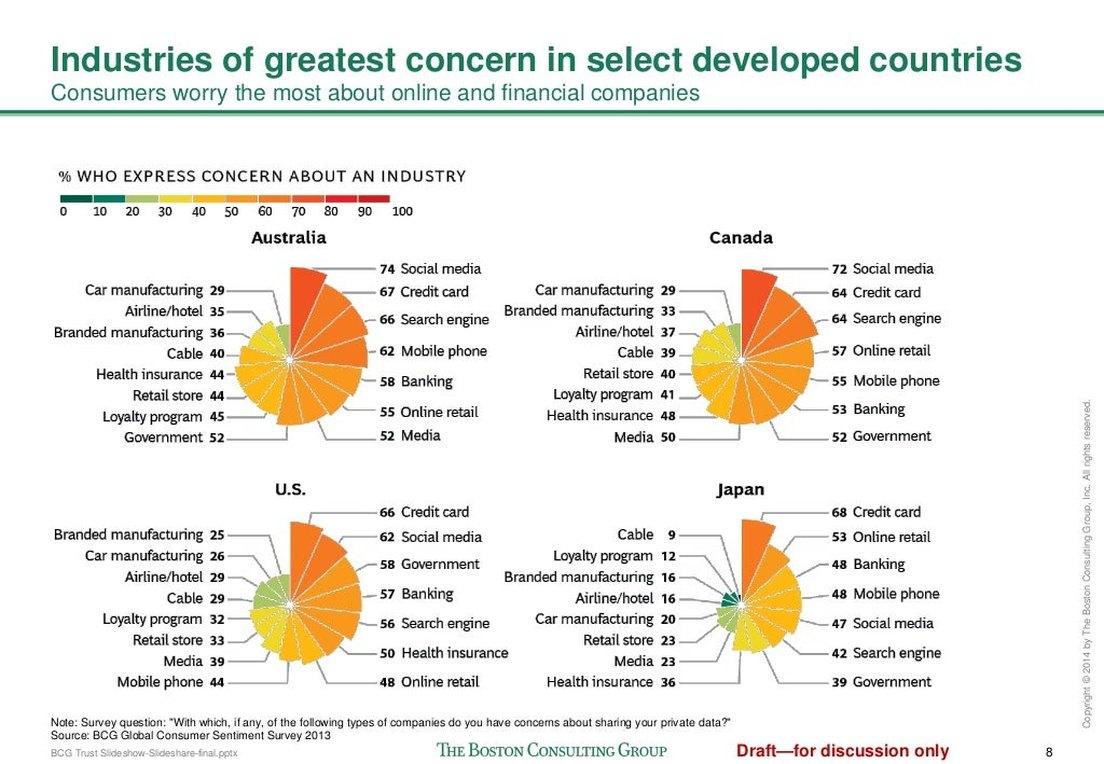
Redraw. Pretty to look at, and the headline's claim cannot be seen in them. The headline names online and financial companies. The charts name social media, search engines, credit cards and banking, and leave the reader to sort them into the headline's two groups, four countries at a time. The same chart carries three slides in a row.
Put the online and financial industries in one strong colour and let the rest go neutral. The headline is then visible before a single label is read.
6. The ask that never arrives
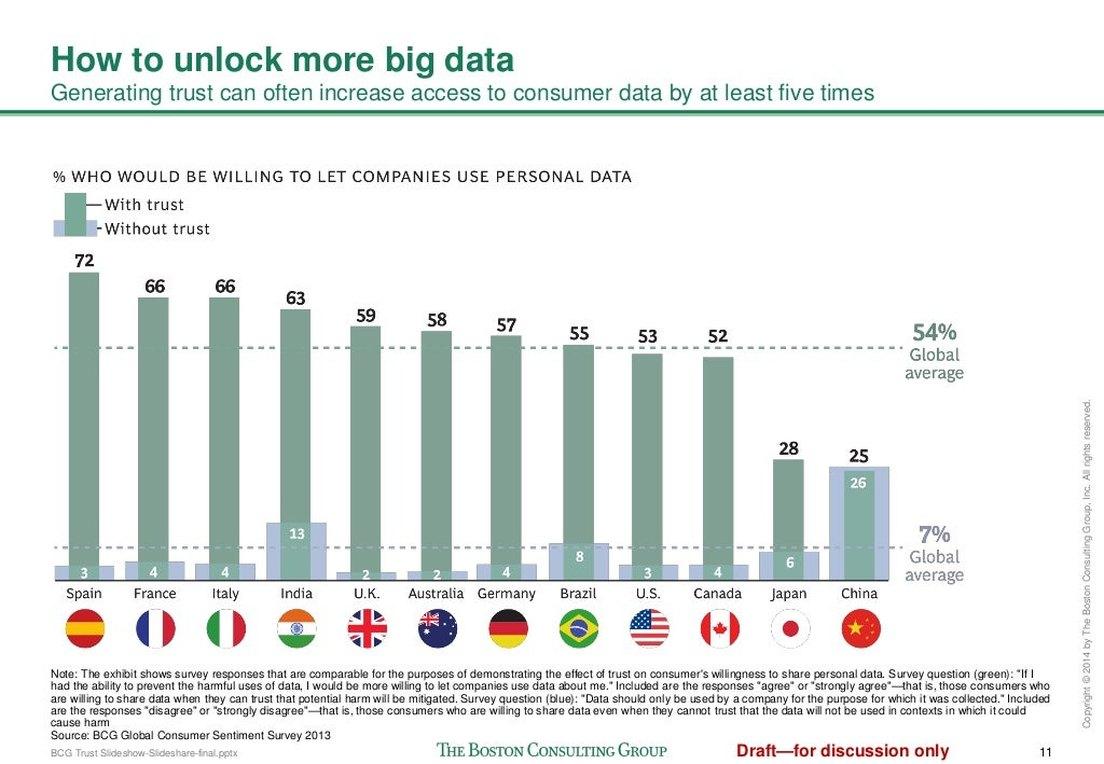
Write it. The deck spends eleven slides earning the right to ask for something. Then it ends on its strongest finding, that trust can raise access to consumer data five times over, with no one to call and nothing to do by Friday. A next step needs a name, a date and a first move. The house is selling advice. The last slide should ask for the meeting.
The after
We put the deck through PointProven, the tool we are building, to see what it would do with the same material.
It reads text, and BCG's slides survive only as pictures. So we typed in every slide's words and every chart's numbers by hand. Then we gave it the question BCG's deck leaves hanging: should a consumer company make earning its customers' trust with their data a strategic priority?
PointProven wrote the argument. Its answer was yes, on four points, each tied to a line in BCG's material: consumers are wary whatever their age, trust sharply raises how much data a company can use, simple controls are a practical way to earn that trust, and financial data is where to start. We added a fifth point, so that BCG's finding about industries had a slide of its own. From the argument it built a ten-slide deck: the situation, the complication, the answer, a slide for each point, and next steps.
Here is the slide that stands where the bubble chart stood.
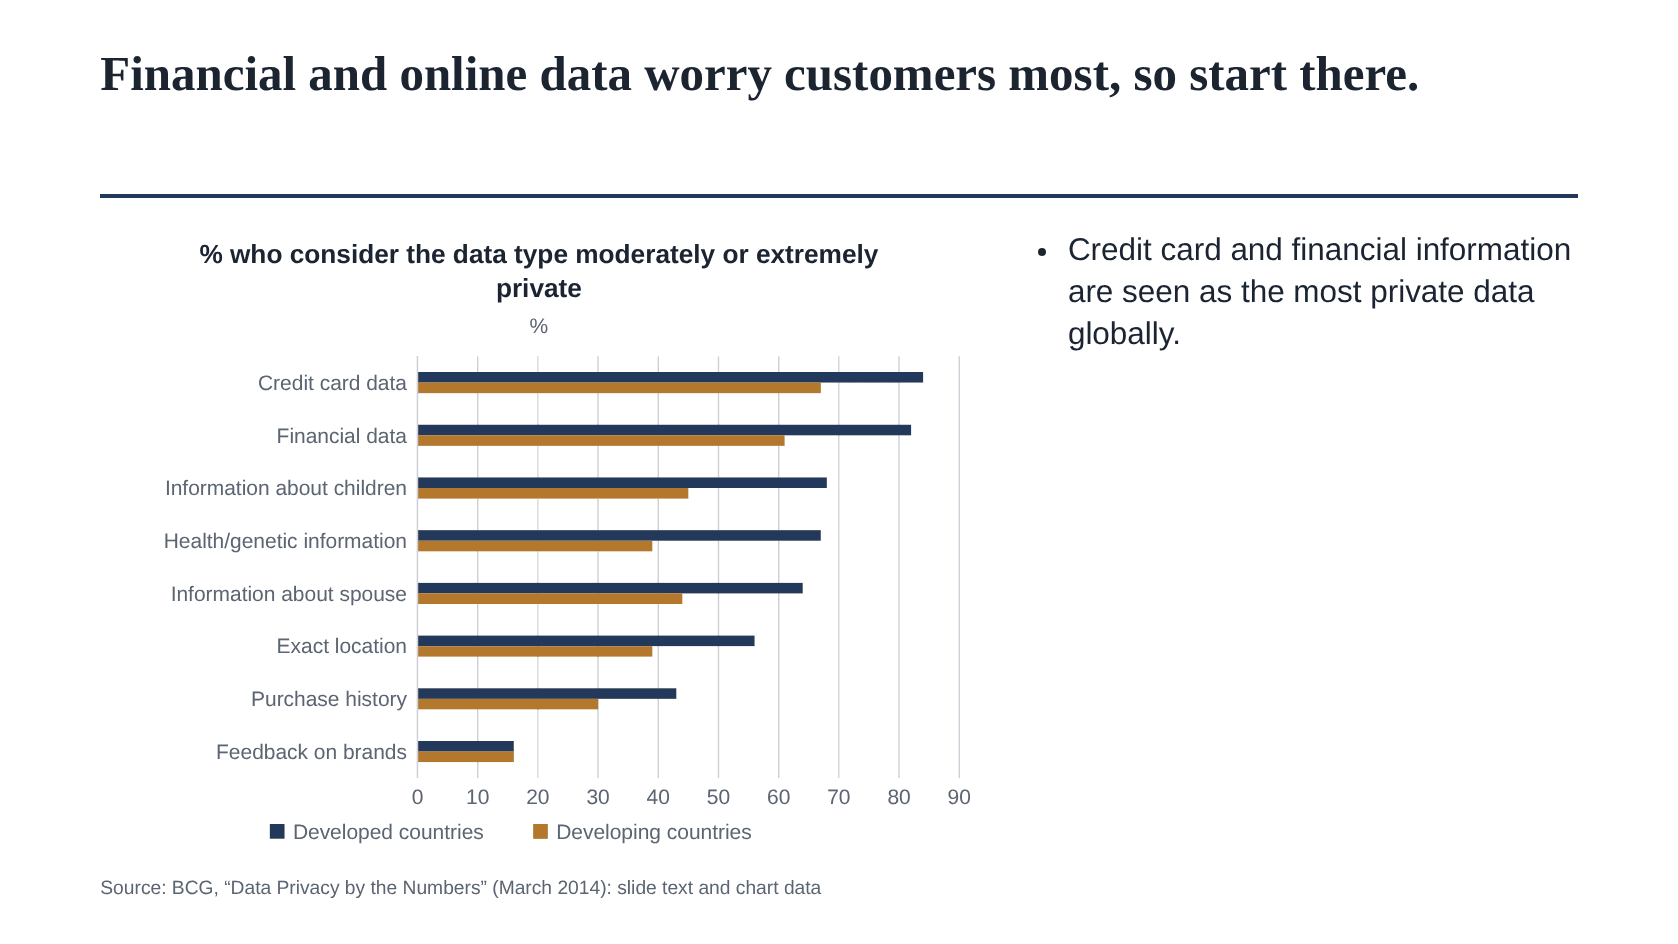
The bars are drawn from BCG's own printed numbers. BCG never printed the bubble chart's values, so we averaged the country figures on its heat-map slide ourselves: nine developed countries against three developing ones. The gap the bubble chart made a puzzle of is now the first thing you see. The longer bar is the developed countries, in every pair but the last.
Notice that the headline has moved. BCG's said who worries more. This one says where to start, because the slide now serves a recommendation. By our own test, the chart shows part of its headline (financial data sits at the top) and all of BCG's.
And here is the slide BCG's deck never had.
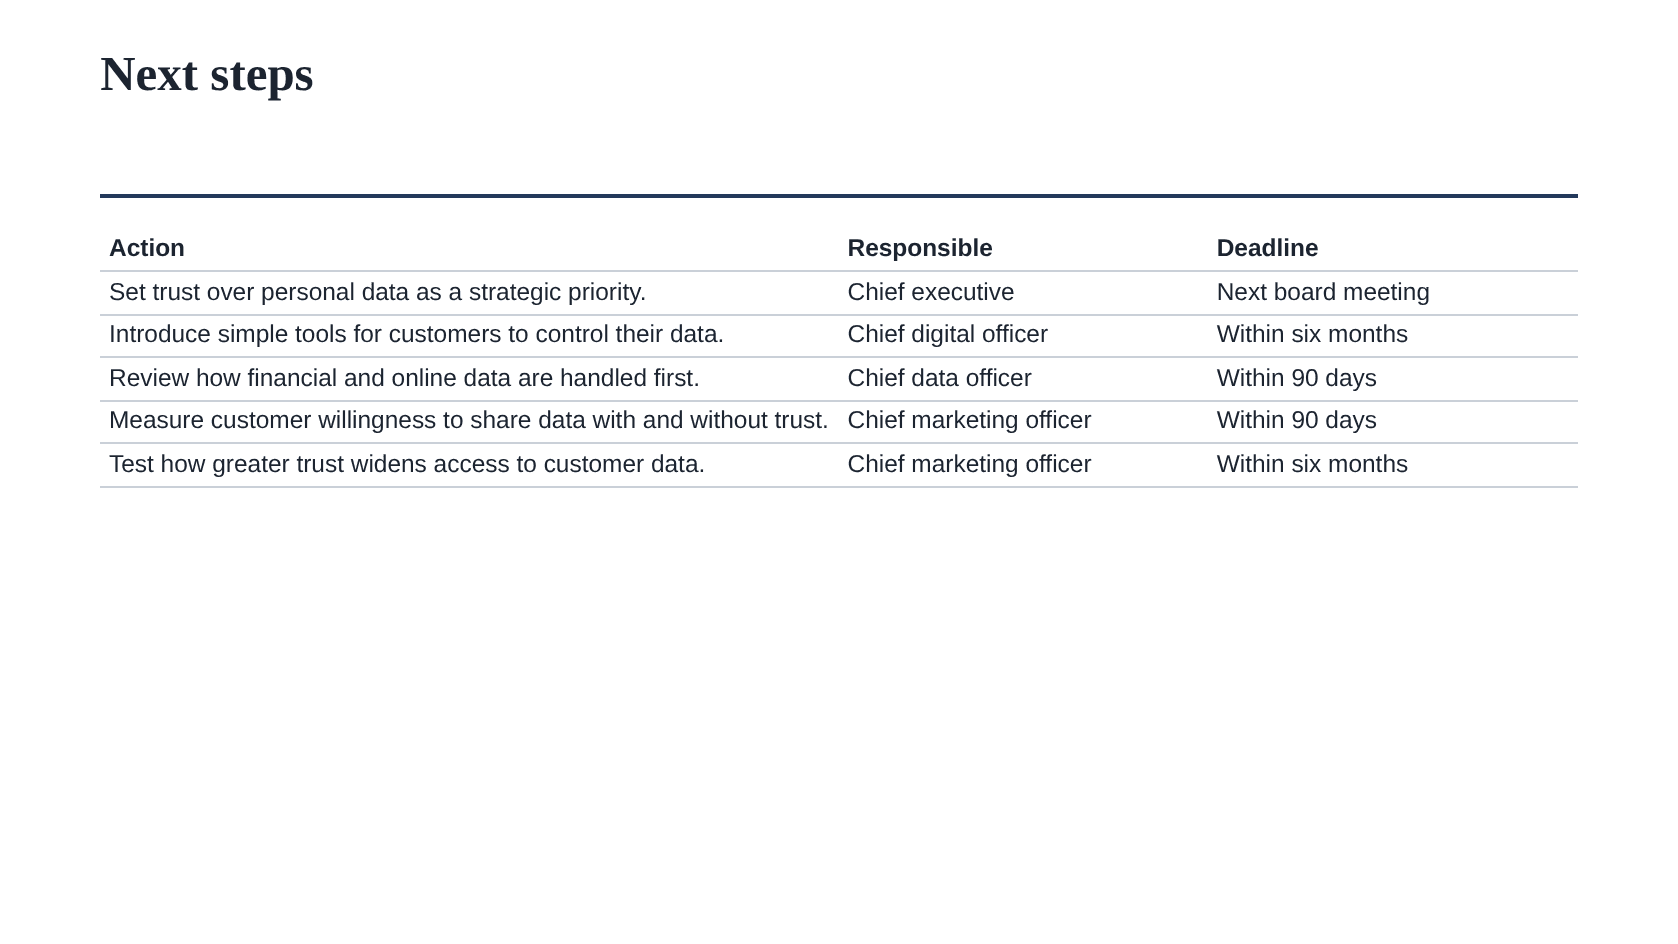
PointProven wrote the five actions and flagged that none had an owner or a date. We supplied those.
It also argued with its own answer. Beside the second point it noted an unstated premise: "Stated willingness to let companies use data when trusted turns into actual data sharing, and the extra data produces enough commercial value to outweigh the cost of earning trust." That is the weak spot in BCG's argument too, and none of our six findings caught it.
What it did not do matters as much. It did not draw a single chart by itself: we pasted each chart's numbers into its grid, and it laid them out. We chose the template. We left its wording as it came, including two thin opening slides we would rewrite. And BCG's charts are still the handsomer ones.
The verdict, by the numbers
- Slides: 12. Short, and the better for it.
- Slide on which the answer is stated: 2. Answer first, as it should be.
- Two-line headlines: 10 of 12, every exhibit. The model.
- Slides carrying a source: 11 of 12. Credibility bought.
- Charts that show their own headline: 6 of 10. Four do not, and one of them is the point of the deck.
- Ends with an ask: no. The common fault, and the costly one.
A chart that cannot show its own headline is not evidence; it is decoration with numbers on it.
What to do
- Steal the two-line headline. Top line pithy, second line the take-away.
- Before you keep a chart, cover the headline and ask whether the chart says it. If it doesn't, redraw.
- Strike every "draft" label the moment the document is public.
- End with an ask that has a name, a date and a first move.
Questions
Is it fair to critique a deck the house published for free?
Yes, and it is the only kind we do. A public deck was made to be read and judged. We show it exactly as its audience saw it, and we say what we would do differently. The arms at the top are a mark of respect for the work.
Why rebuild only one slide?
Because one rebuild proves the method and forty would prove only patience. The bubble chart is the fault a reader can learn from most: a good-looking chart that hides its own point.
What would the missing last slide say?
One sentence with a name and a date. Something like: "We have run this diagnostic for companies like yours. We would like to run it for you, and we can start on the fourth." The deck has earned that ask by slide eleven. It just does not make it.